B → τ ν
The Branching Ratio of B → τ ν can be used to determine
Rb=ρ2+
η2 independently from
the determination of Vub from semi-leptonic B decays. On the other side
not having used BR(B → τντ) as an input in the
analysis, we can indirectly determine its value as an output of our
fit. This is obtained starting from the UTangles determination of
ρ and
η, combined with the
experimental determination of Vub Vcb, adding
the experimental measurement of Δmd and Δms
to determine fB√BBd, and using the
lattice value of BBd=1.22 ± 0.12
to obtain fB from it. In this way, the prediction is obtained
without using the value of fB taken from lattice calculations,
which has a larger relative uncertainty than BBd.
We obtain the values quoted below:
|
BR(B → τντ) = (0.73 ± 0.12) × 10-4
|
using the rest of the contraints
and not using Vub and lattice quantities [noVub]
|
|
BR(B → τντ) = (0.81 ± 0.12) × 10-4
|
using all the contraints available
except the lattice quantities [Vub all]
|
|
BR(B → τντ) = (0.83 ± 0.12) × 10-4
|
using all the constraints available and
using the inclusive value of Vub [Allincl]
|
|
BR(B → τντ) = (0.74 ± 0.12) × 10-4
|
using all the constraints available and
using the exclusive value of Vub [Allexcl]
|
Although all the predictions above are compatible within the errors,
a comparison of the values obtained from the above determinations gives the
measure of the correlation of this prediction with Vub
in the overall UT fit, since all other input quantities are the same.
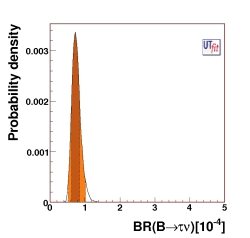
The result p.d.f., obtained using all the informations in the fit,
is given in the plot below.
(EPS)
[JPG]
|
SM prediction on B → τ ν
using no Vub and no lattice
BR(B → τ ν) = (0.73 ± 0.12)10-4
([0.522,1.018] @ 95% prob.)
|
|
(EPS)
[JPG]
|
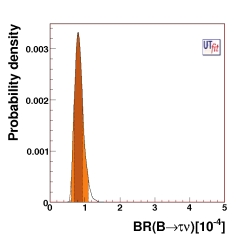
SM prediction on B → τ ν
using Vub incl+excl and no lattice
BR(B → τ ν) = (0.81 ± 0.12)10-4
([0.566,1.224] @ 95% prob.)
|
|
For comparison, using all the constraints available, fB value from LQCD
(fB = (200 ± 20) MeV)
and the inclusive determination of Vub
(Vub = (39.9 ± 1.5 ± 4.0) × 10-4), one would obtain
BR(B → τντ)=(0.86 ± 0.12) × 10-4.
Note that in this case, contrary to the case of Δ ms,
a better agreement between the prediction and the experimental world average
(BR(B → τντ)=(1.51 ± 0.33) ×
10-4, combining Belle and BaBar) is found when the inclusive value of
Vub is used in the fit. In other words, the experiemental measurement is in better
agreement with the value of the inclusive determination of Vub.
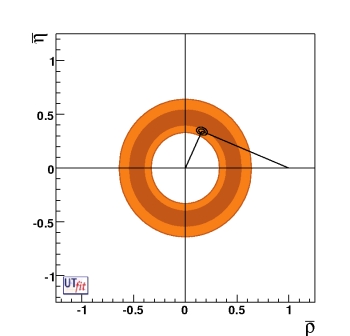
This Branching Ratio depends upon |Vub|2 and the B decay constant fB.
We show here the bound on the
(ρ;
η) plane (giving the
total UT fit result as a reference), obtained using the 2008 HFAG average for the
experimental measurement
translated into a bound on Rb.
An other interesting exercise
consists in assuming the output of the UT analysis and translate
the measurement of the Branching Fraction into a determination of
fB, to be compared to Lattice calculations.
(EPS)
[JPG]
|
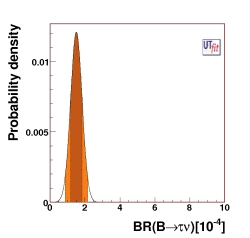
Experimental likelihood of B → τ ν
BR(B → τ ν) = (1.51 ± 0.33) 10-4
([0.86,2.16] @ 95% prob.)
|
|
(EPS)
[JPG]
|
bound from B → τ ν on the
(ρ;
η) plane
|
|
(EPS)
[JPG]
|
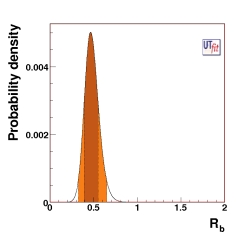
1D p.d.f. of Rb from B → τ ν
Rb = 0.47 ± 0.08
([0.30,0.77] @95% Prob.)
|
|
(EPS)
[JPG]
|
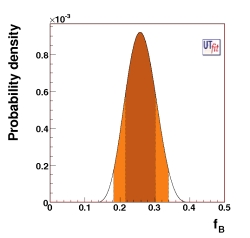
1D p.d.f. of fB from B → τ ν
fB = 0.259 ± 0.042 GeV from the exp+UTfit angle fit
fB = 0.200 ± 0.020 GeV Lattice QCD
|
|
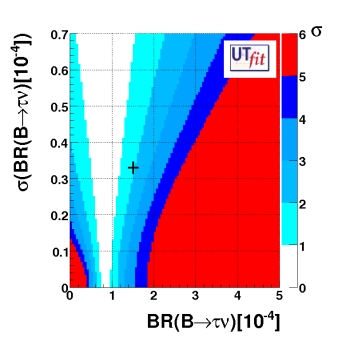
Compatibility plot for B → τ ν
The compatibility plot describes the comparison between the indirect parameter determination
from the global fit excluding the B → τ ν measurement and its direct experimental
value.
The plot shows the compatibility between direct and indirect determination,
given in terms of standard deviations, as a function of the measured value
and its experimental uncertainty.
In more detail the distribution for the difference between direct and indirect value is first
built; the ratio between central value and standard deviation for that pseudo-Gaussian
distribution is then taken as compatibility indicator.

![[JPG]](btaunu_novub_nofbSM.jpg)
![[JPG]](btaunu_nofbSM.jpg)
![[JPG]](btaunu_lik.jpg)
![[JPG]](b2taunu.jpg)
![[JPG]](btaunu_Rb.jpg)
![[JPG]](btaunu_fB.jpg)
![[JPG]](pull_btaunu.jpg)